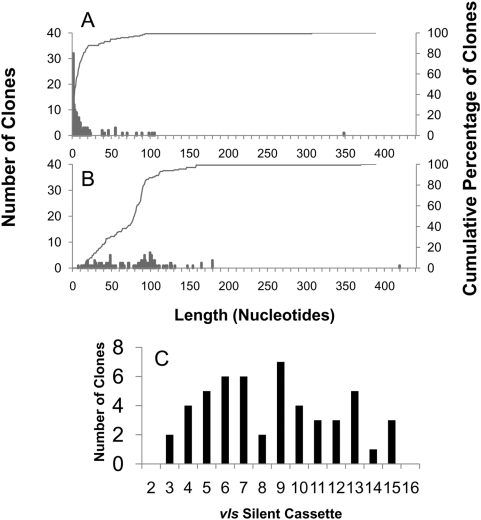
Figure 7. Lengths of minimum and maximum predicted recombination events in 126 clones identified as having a single, well-defined recombination event.
Histograms of the deduced (A) minimum and (B) maximum lengths of recombination are depicted as bars; the cumulative percentage of clones having predicted minimal or maximal recombination lengths≤the length shown are represented as lines. Panel C represents the putative silent cassette usage in clones with a single recombination event in which the silent cassette source could be determined unambiguously.

