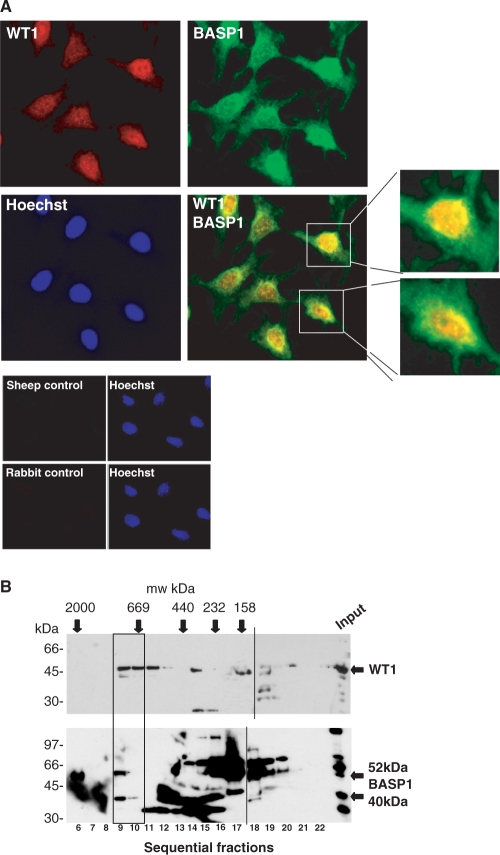
Figure 1.
WT1 and BASP1 localization in MPC5 podocyte precursor cells. (A) MPC5 cells were subject to immunofluorescence with rabbit anti-WT1 (red) and sheep anti-BASP1 (green) antibodies. A merge of the two images is shown in the bottom right panel, along with enlarged images of the two cells indicated. Cells were counterstained with Hoechst. Below, control immunoflourescence with each of the sheep and rabbit secondary antibodies is shown. (B) Gel filtration was performed with nuclear extracts prepared from MPC5 cells and the fractions immunoblotted with either anti-WT1 (top) or rabbit anti-BASP1 antibodies (bottom). Calibration (in kilodalton) is above the autoradiographs, fraction numbers are below and molecular weight markers (in kilodalton) are at left. WT1, BASP140 and BASP152 are each indicated by arrows. The WT1 complexes that co-fractionate with BASP1 are boxed. The dashed line indicates the alignment from two separate gels that were immunoblotted together.

