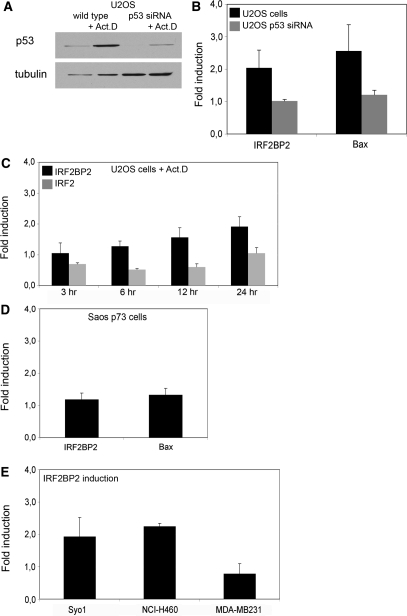
Figure 2.
Upregulation of IRF2BP2 after p53 induction. (A) Induction of p53 in U2OS wild-type or p53 knockdown cells. Cells were treated with 5 nM Act.D for 24 h, before whole cell extracts were prepared and protein levels of p53 and tubulin as loading control were determined. (B) Expression changes in U2OS wild-type and p53 knockdown cells after treatment with 5 nM Act.D for 24 h, compared to untreated cells. Whole RNA was extracted and quantitative RT-PCR was performed, with primers for IRF2BP2 and Bax. Upregulation is shown after normalization against GAPDH and calculated over the untreated control. Error bars represent the SD of three independent experiments. (C) Kinetics of expression changes of IRF2BP2 and IRF2 upon Act.D treatment. U2OS cells were treated for the indicated time points with 5 nM Act.D before whole RNA was isolated, followed by quantitative RT-PCR for IRF2BP2 and IRF2 expression. Error bars result from two independent experiments. (D) Induction of target genes by p73α in Saos t.o. cells induced for 24 h and treated with 5 nM Act.D for another 24 h prior to RNA isolation. Error bars represent the SD of three independent experiments. (E) Human cell lines containing wild-type p53 (Syo1, NCI-H460) or no functional p53 (MDA-MB231) were treated with 5 nM Act.D for 24 h. Changes in the levels of IRF2BP2 mRNA are shown after normalization to GAPDH and calculated against untreated controls. Error bars result from two independent experiments.

