Figure 5.
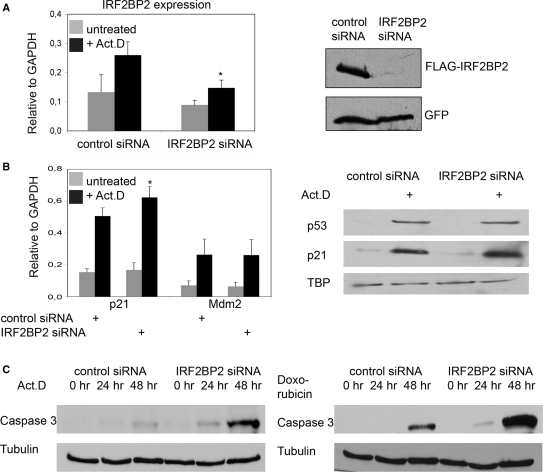
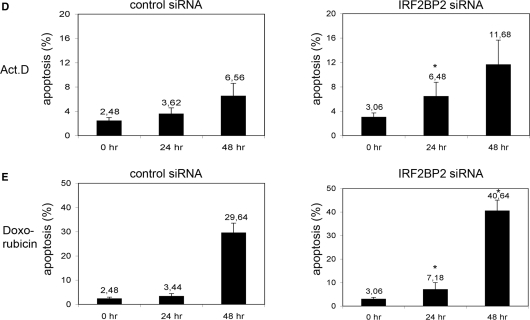
Knockdown of IRF2BP2 renders cells sensitive to chemotherapeutic stress. (A) Knockdown of IRF2BP2 in U2OS cells using lentiviral vectors or ON-TARGETplus oligo siRNAs. Efficiency of the knockdown was monitored by analyzing the transcript-levels of IRF2BP2 relative to GAPDH and by transient retransfection of 500 ng FLAG-IRF2BP2 followed by western blotting with anti-FLAG antibody. GFP-staining was used to monitor transfection efficiency. SD was derived from three biological replicas. Asterisk indicates statistical significance shown by Student's t-test (P < 0.05) compared to non-targeting siRNA. (B) Expression analysis showing the induction of p21 and Mdm2 mRNA in the control and the IRF2BP2 knockdown cells after treatment with 5 nM Act.D for 24 h. SD was derived from three independent experiments. Asterisk indicates statistical significance shown by Student's t-test (P < 0.05) compared to non-targeting siRNA. Western blot showing the levels of p53 and p21 in the IRF2BP2 knockdown and the control siRNA cells. TBP was used as a loading control. Whole cell extracts of the IRF2BP2 knockdown and the control cells were prepared after treatment with either Act.D or doxorubicin and 15 μg of protein from each sample were used for western blot and stained against the indicated proteins. (C) Activation of Caspase 3 after chemotherapeutic treatment. IRF2BP2 knockdown or control cells were treated for the indicated times with 5 nM Act.D (left panel) or with 1 nM doxorubicin (right panel) before Caspase 3 levels were analyzed. Tubulin was used as loading control. (D) Quantification of apoptosis determined by FACS analysis of the control (left) and the IRF2BP2 knockdown (right) cells. Cells were treated for the indicated times with 5 nM Act.D prior to harvest and propidium iodide staining for FACS. Apoptotic Sub-G1 population is shown as percentage of all cells. SD was derived from three independent experiments. Asterisks indicate statistical significance shown by Student's t-test (P < 0.05) compared to the non-targeting siRNA. (E) Quantification of apoptosis after treatment with 1 nM doxorubicin. After the indicated time points IRF2BP2 knockdown and control cells were harvested and propidium iodide staining was performed. Apoptotic Sub-G1 population is shown as percentage of all cells. SD was derived from three independent experiments. Asterisks indicate statistical significance shown by Student's t-test (P < 0.05) compared to the non-targeting siRNA.


