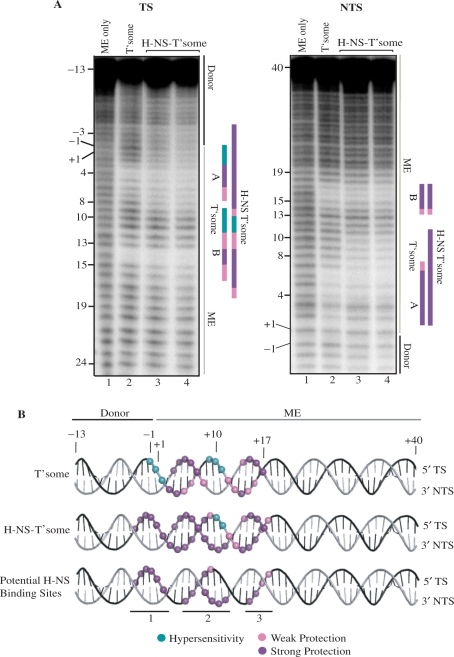
Figure 3.
Hydroxyl radical footprinting of H-NS-transpososomes. (A) Transferred (TS) and non-transferred (NTS) strand footprints are shown. Transpososome assembly reactions were set up as described in the ‘Materials and Methods’ section with the 53 bp ME substrate (Figure 2B) labeled with 32P at the 5′ terminus of either the TS or the NTS. Samples in lanes 3 and 4 were from H-NS-transpososome assembly reactions performed with 0.6 and 1.8 μM H-NS, respectively (these reflect the H-NS mobility shifts of lanes 8 and 10, respectively in Figure 2B). The +1 position is the first base pair of the ME and the –1 position is the first base pair of the flanking donor DNA. Regions of strong and weak hydroxyl radical protection are indicated by purple and pink vertical bars, respectively. Regions of hydroxyl radical hypersensitivity are represented by vertical green bars. Binding sites of transposase, referred to in the text as zones A and B, are labeled. (B) Positions of hydroxyl radical protection and hypersensitivity are summarized on helical representations of DNA for the transpososome and H-NS-transpososome. The three potential binding sites for H-NS (sites 1–3) are shown on the bottom helical representation. These sites are defined by differences in hydroxyl radical protection and hypersensitivity in the transpososome versus the H-NS transpososome.

