Figure 6.
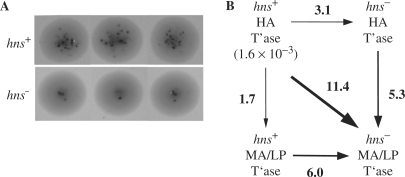
In vivo transposition assays in isogenic hns+/hns− E. coli strains. (A) Relative transposition frequency of mini-Tn5-lacZ in isogenic hns+ and hns− strains as measured using a papillation assay. Three colonies of isogenic hns+ and hns− strains transformed with a plasmid encoding HA transposase are shown. The dark spots are LacZ+ papillae; the number of papillae formed per colony provides a measure of the relative frequency of transposition of a mini-Tn5-lacZ transposon within the colony. Note that the photographs were taken when colonies were roughly the same size, which corresponded to 50 and 90 h of growth, respectively, for the hns+ versus the hns− strain. (B) Box diagram showing the fold-changes in transposition frequency in cis as measured by mating out for hns+ and hns− strains expressing HA transposase or MA/LP transposase. Transposition frequencies were calculated by dividing the number of SmRCmR colonies (transposition events) by the number of SmR colonies (total exconjugants) obtained per 0.1 ml of mating mix. Transposition frequencies represent an average from at least two independent experiments. The transposition frequency for the hns+/HA transposase is shown. Arrows point in the direction of the fold-decrease (e.g. hns+/HA transposase supported transposition at a 3.1-fold higher level relative to hns−/HA transposase).

