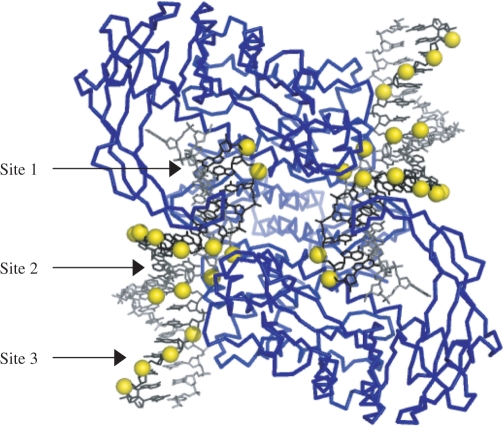
Figure 7.
Three-dimensional representation of the Tn5 transpososome with potential H-NS binding sites indicated. A model of the Tn5 transpososome formed with the HA transposase and 20 bp OEs is shown (37,61) along with potential H-NS binding sites 1 to 3. Note that all three sites include portions of the DNA that are not encompassed by transposase on at least one surface. Transposase is shown as blue. The OE's DNA strands are depicted in black and grey for the transferred strand and non-transferred strands, respectively. Yellow spheres indicate the position of the phosphate backbone where H-NS binding may occur.

