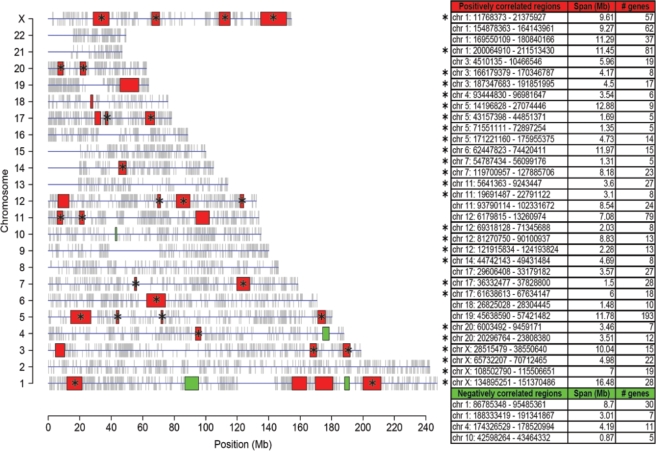
Figure 4.
Genomic positions of co-expressed regions in the human chromosomes. The analysis of CER was carried out using the LCS statistic, with a sliding window approach applied to the human genome. Regions harbouring genes with highly positive and negative correlation of expression in myelopoiesis are shown in red and green, respectively. The table on the right reports details on CER localization, span, and the number of genes from the region, which is present in the gene expression data matrix. An asterisk is used to mark positively correlated CER, which were selected for subsequent analyses, including the CEMR and motif discovery analyses.

