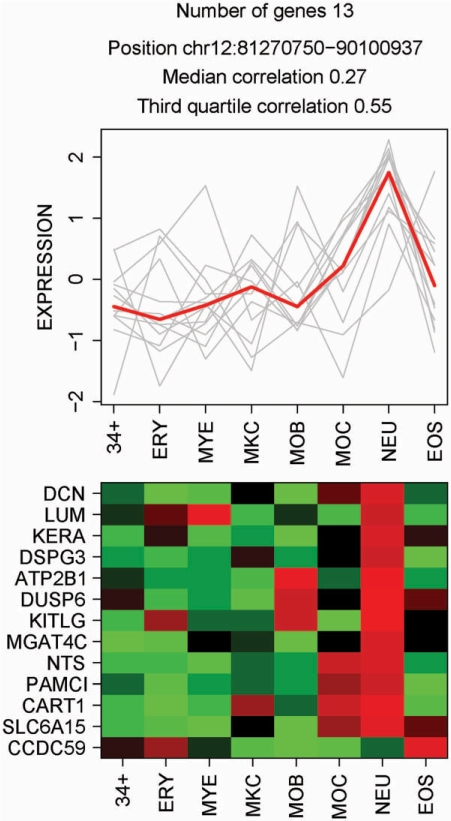
Figure 5.
Example of a co-expressed region. Expression plot and heatmap, with genes ordered by genomic position, describing a region of chromosome 12 (81 270 750 − 90 100 937) harbouring 13 co-expressed genes. The red-bold line represents the median of expression profiles in the gene set. (34+: CD34+HSC; ERY: Erythroblasts; MYE: Myeloblasts; MKC: Megakaryoblasts; MOB: Monoblasts; MOC: Monocytes; NEU: Neutrophils; EOS: Eosinophils).

