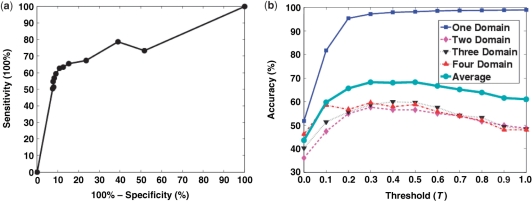
Figure 3.
The effect of threshold on the performance of FIEFDom for the SCOP 1.73 (30%) dataset. (a) Receiver operating characteristic (ROC) curve averaged over all of the domain sets is plotted as the threshold (T) is varied from 0 to 1 in intervals of 0.1. (b) One-domain (blue solid line), two-domain (pink dashed line), three-domain (black dotted line), four-domain (red dashed-dotted line) and the average domain boundary prediction accuracy are plotted as a function of the threshold value, T. Based on the maximum and slow variability of the accuracy values over a range of T values, we selected T = 0.4 as the appropriate value to be used in our model.

