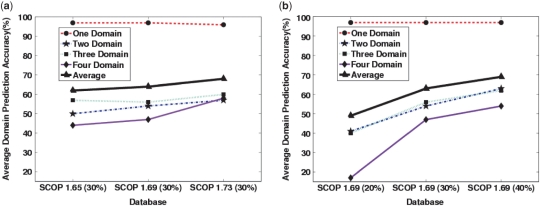
Figure 4.
(a) One-domain (red dashed line), two-domain (blue dashed-dotted line), three-domain (green dotted line), four-domain (solid magenta line) and average (bold solid black line) domain prediction accuracies are plotted as a function of database version. As time progresses, new information can be added to the prediction algorithm by updating the RPS. As the number of sequences in the database increases, the prediction accuracy improves. (b) The same domain prediction accuracies as in (a) are plotted as a function of maximum sequence identity cutoff in the RPS. More structural information is added to the prediction system by increasing the maximum sequence identity among proteins in the RPS.

