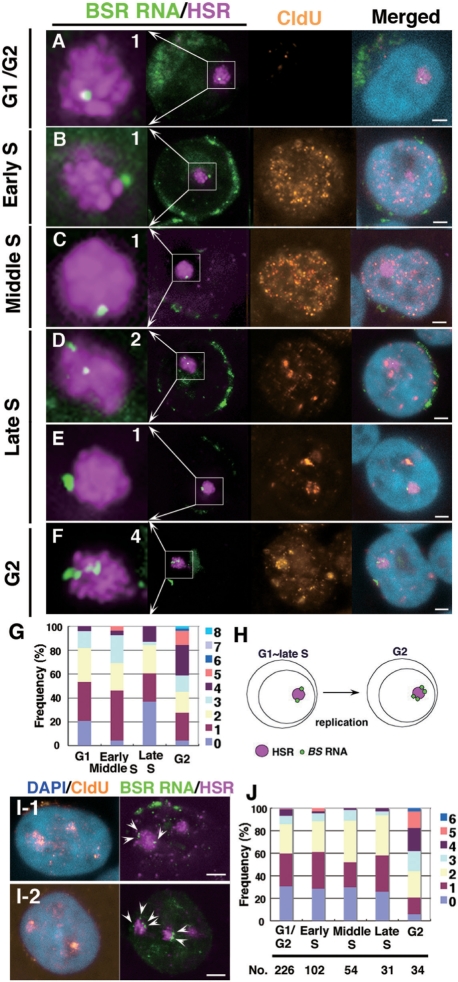
Figure 2.
The number of transcriptional specific points increased after HSR duplication. Logarithmically growing clone 22 cells (A–G) or HSR-CFP cells (I, J) were pulse-labeled (15 min) with CldU and fixed directly with PFA. Both BSR RNA (green) and HSR DNA (magenta) were detected by FISH; CldU (brown) was simultaneously detected by immunofluorescence, and DNA was counterstained with DAPI (blue). According to the CldU pattern in the nucleus, each cell was determined as being in G1/G2 (no signal), or early, middle or late S-phase. G2-phase cells were specifically identified among the cells chased 2 h after the CldU pulse-labeling, and cells showing a CldU pattern typical of late S-phase should be in G2 at the time of harvest. As expected, the HSR, which replicate at the end of S-phase (20), was stained with CldU in these cells (F and I). For such cells, the number of BSR RNA foci per each HSR was scored; these are noted in the left-most enlarged images of A–F. The data obtained for each stage are summarized in the graph (G for clone 22 and J for HSR-CFP cells). We scored more than 50 HSRs for each stage (G) or the numbers indicated in the graph (J). The graph suggested that the number was almost doubled after the duplication of the HSR (H). The green signal surrounding nuclei is BSR RNA transported to the cytoplasm. All bars in images indicate 2 µm.

