Figure 3.
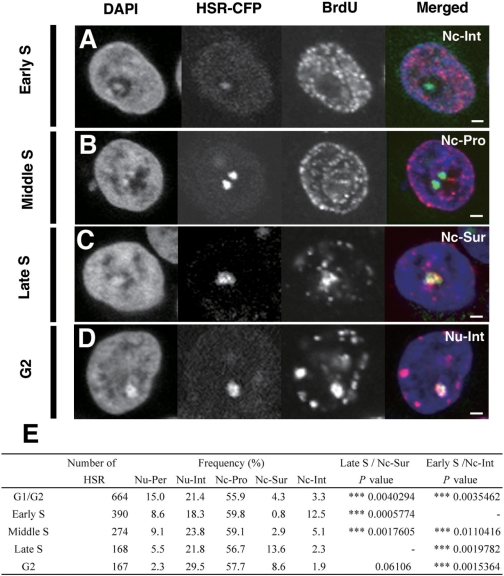
Nucleolar visits by the HSR are biased to specific cell-cycle stages. The logarithmically growing HSR-CFP cells were pulse-labeled by BrdU for 15 min, harvested, and fixed (A–C). Alternatively, cells were further chased in fresh medium for 2 h before the harvest (D). The incorporated BrdU was detected by immunofluorescence and was viewed simultaneously with HSRs that were visualized by binding of the LacR-CFP protein. The cell-cycle stages of individual cells were determined by the BrdU distribution pattern. G2-phase cells were identified among cells chased 2 h after the BrdU pulse, as in Figure 2. The representative images for each cell-cycle stage are shown in A–D. The localization of HSRs (for abbreviations, see the legend to Figure 1), as well as the cell-cycle stages, were determined by confocal z-series images. These data are summarized and shown in E. In the table, the number of HSRs examined at each cell cycle stage (number of HSRs) and the percentage of the HSR at each location (frequency) was noted. The significances of the Nc-Sur at Late S or the Nc-Int at Early S among the other cell-cycle stages were analyzed by the analysis of variance (ANOVA), and the results were noted as P-values. All bars in images indicate 2 µm.

