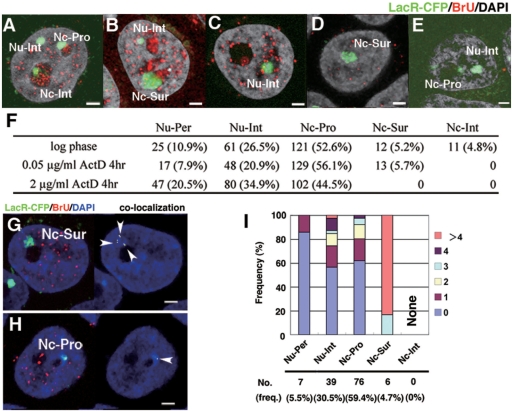
Figure 4.
Nucleolar visits by the HSR are transcription-dependent. Logarithmically growing HSR-CFP cells were treated with 0 µg/ml (A, B), 0.05 µg/ml (C, D, G–I), or 2 µg/ml (E) of actinomycin D for 3 h and harvested. During the last 15 min before the harvest, BrU was added to all cultures. Incorporated BrU was detected by red fluorescence, and DNA was counterstained by DAPI (gray in A–E, blue in G, H). The slide was viewed by confocal microscopy, and the representative z-section images are shown (A–E, G, H). The location of the HSR, which was visualized by binding of LacR-CFP (pseudo-colored in green), was determined as in Figure 1, and is noted in the panels. The number of HSRs at each location as well as their percent of the total (in parentheses) is summarized in F. The co-localization of HSR (green) and BrU (red) among the images (left panel of G, H) was determined, and it was shown in right panel (indicated by arrowheads). The number of co-localization signals was counted for HSRs at each location, as in Figure 1J, and it was plotted in I. All bars in images indicate 2 µm.

