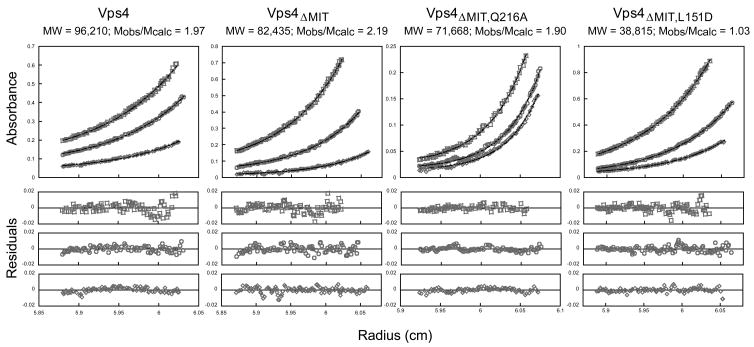
Figure 4.
Vps4 proteins dimerize in solution
Representative equilibrium sedimentation profiles for full length Vps4 (panel 1), Vps4ΔMIT (panel 2), Vps4ΔMIT, Q216A (panel 3, Interface 1 mutant), and Vps4ΔMIT, L151D (panel 4, Interface 2 mutant). Sedimentation data are plotted as absorbance versus the distance from the center of the axis of rotation (radius). To simplify the plot, the radius was normalized so that the data from all three sectors (i.e. three different concentrations) overlap. In each case, data from three protein concentrations and one speed are displayed (open symbols) along with the best single ideal species fit (solid lines). The best fits for each protein were derived from global fits to data collected at three concentrations and two speeds. The residuals (differences between the raw absorbance data and the fit are shown below each panel.

