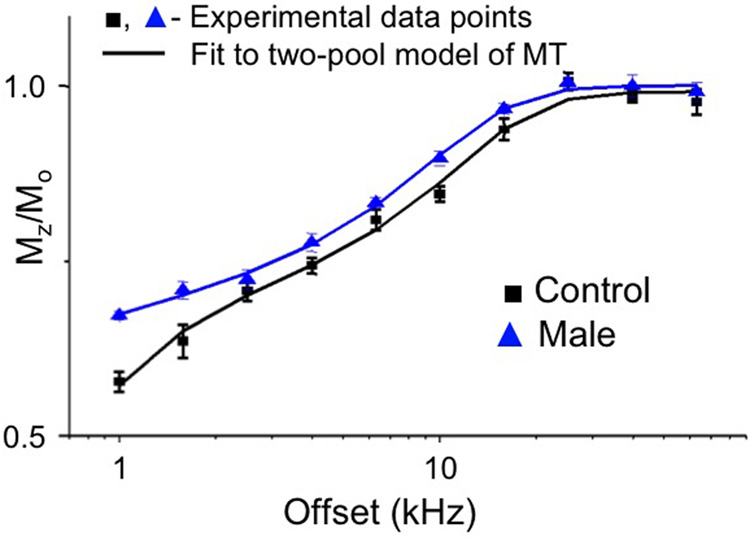
Figure 2.
Acquired z-spectra and fitted results for healthy control (black) and AMN patient (blue) presented in Figure 1. Solid lines indicate qMT fit result, while data points represent the mean normalized signal intensity in the dorsal column. Similarly to figure 1, the dorsal column signal intensity in the AMN patient is elevated for all offset frequencies with respect to the control.

