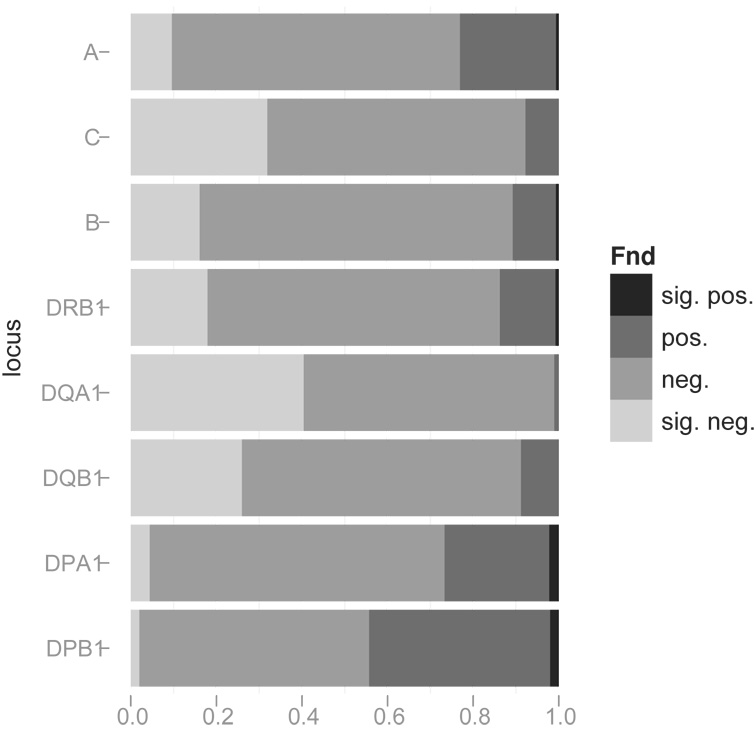
Figure 6. Bar plot of Fnd results.
Shading indicates proportions of populations with significantly negative (suggestive of balancing selection and/or gene flow), negative, positive, and significantly positive (suggestive of directional selection and/or genetic drift) values of the normalized deviate of homozygosity (Fnd), as tested by Slatkin’s implementation of the Monte Carlo approximation of the Ewens-Watterson exact test, using a two-tailed test (p < 0.05) of the null hypothesis of neutrality.

