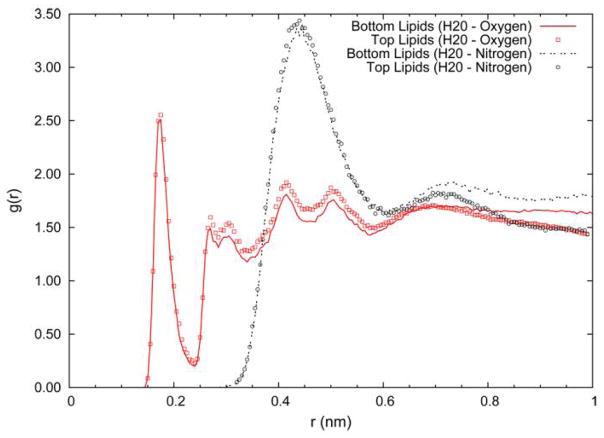
Figure 4.
Radial distribution function between water oxygen atoms and lipid phosphate oxygens (squares and solid line) and between water oxygen atoms and lipid choline nitrogen atom (circles and dashed line). All results are from simulation 11 (strong lipid-substrate interactions). The lines give the results for the inner lipid leaflet (facing silica), the symbols give the results for the outer lipid leaflet (facing bulk water).

