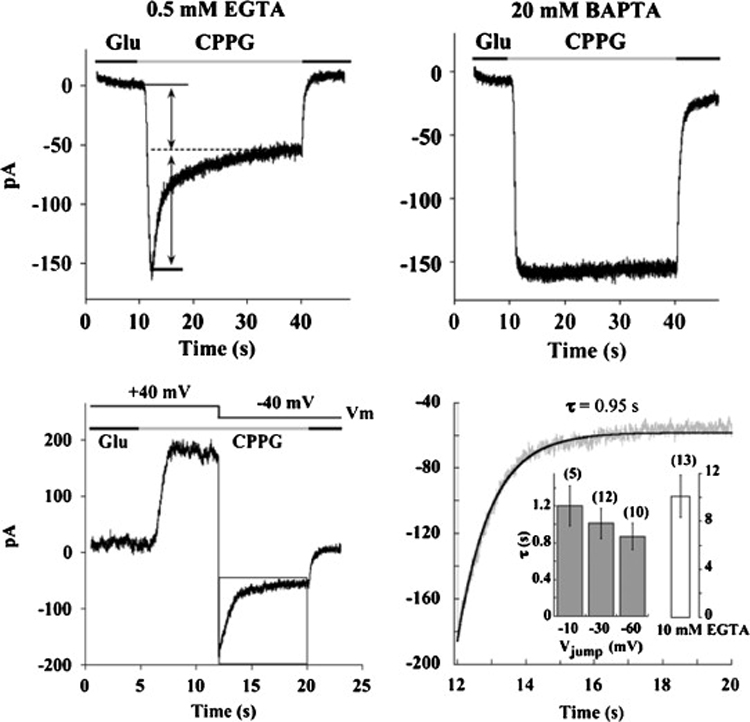
Fig. 6. Ca2+-dependent depression of synaptic cation current in tiger salamander On bipolar cells.

Top: Representative responses to application of the mGluR6 antagonist CPPG, one from a cell recorded with a solution containing 0.5 mM EGTA (left) and the other with a solution containing 20 mM BAPTA. Holding potential of each cell was −40 mV. Bottom: Left panel is the response of another cell to the application of CPPG at +40 mV. Note the absence of desensitization. A jump from a holding potential of +40 mV to −40 mV results in an exponential decay in the cation current. Right panel is an expansion of the decay of the transduction current indicated by the box on the left. Dark line is the fit with a single time constant of 0.95 seconds. Inset: Filled bars represent the mean ± s.e.m. of the time constant at each voltage in cells that were buffered with 0.5 mM EGTA. Open bar is the time constant measured in cells buffered with 10 mM EGTA when stepped to −40 mV. From Nawy, 2004.
