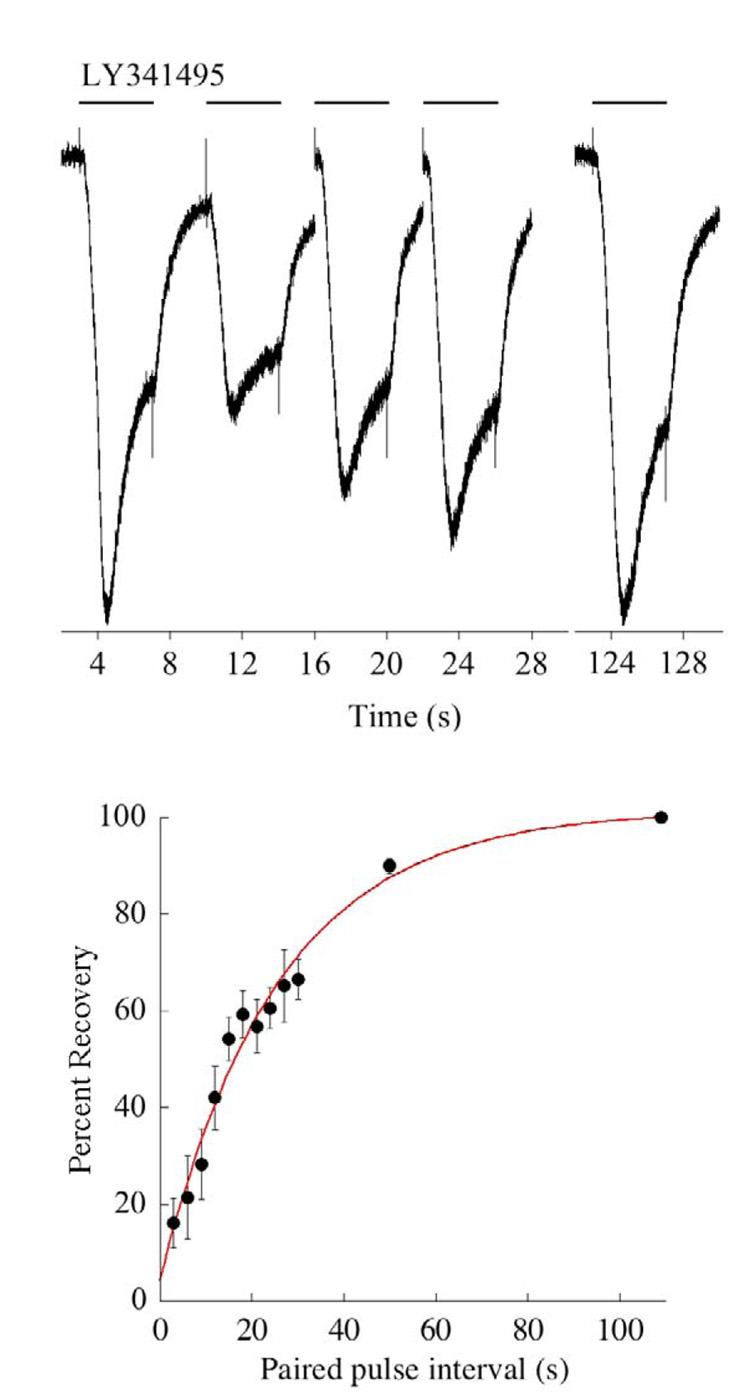
Fig. 7. The timecourse of recovery from desensitization.
Top; Example of a paired pulse experiment in which a conditioning pulse of the mGluR6 antagonist LY341495 was first applied to induce desensitization, followed by a second test application at variable times to measure the amount of recovery. Only the responses at the three shortest intervals are shown, followed by the response after complete recovery (note break in x-axis). Holding potential was −40 mV, and cells were dialyzed with 0.5 mM EGTA. Bottom: Summary of the experiment conducted in 5 cells. Smooth line is a single exponential fit with a time constant of 25.4 seconds.

