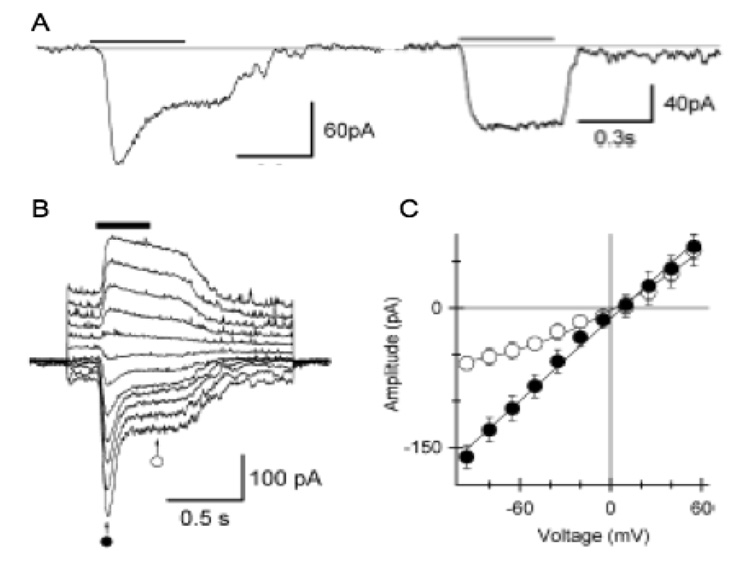
Fig. 8. Ca2+-dependent depression is also present in the light responses of mammalian rod bipolar cells.
A: Response to a step of saturating light in a rod-driven bipolar cell (left), and a cone-driven ON bipolar cell (right). The light response has the characteristic transient peak in the rod-driven bipolar cell, but not in the cell driven by cones. B: Response to a light step as a function of holding voltage. At positive potentials, when the driving force for Ca2+ is reduced, the depression is less pronounced. C. Averaged I-V relation measured at the times indicated by the symbols in (B). The I-V relation measured at the peak of the response is linear, but the I-V measured at steady-state rectifies outwardly as would be expected if Ca2+ influx depresses the steady-state response. From Berntson et al., 2004a.

