Table 4.
Mean±SD of raw scores on neuropsychologicalmeasures
| Young (n=12) | Elderly (n=12) | p Valuea | Z scoreb | |
|---|---|---|---|---|
| Phonological Fluency | 40.33±11.74 | 39.75±12.90 | .9088 | 1.00 |
| Digit Forward | 8.75±2.05 | 8.92±2.11 | .8462 | .7693 |
| Digit Backward | 7.25±2.49 | 7.00±2.37 | .8036 | .7702 |
| Blocks Forward | 9.33±1.23 | 7.33±1.07 | .0003 |  |
| Sternberg* | 259.10±155.67 | 435.06±97.36 | .0031 | |
| Fine Finger Movementsc | 76.73±17.55 | 68.28±19.32 | 2839 | .1239 |
| Grooved Pegboard* | 67.12±9.33 | 96.29±17.09 | .0001 |  |
| CANTAB: Motor* | 774.50±156.22 | 1061.07±157.04 | .0118 | |
| CANTAB: Big/LittleCircle* | 704.88±107.47 | 902.1±157.04 | .0016 | |
| Comprehensive Trail Making Test | 2.53±7.31 | 8.5±11.67 | .1472 | .1259 |
| Balance+Problem Solving Task*c | 74.10±20.81 | 117.24±62.28 | .0339 | .0966 |
| Semantic Fluency | 22.28±3.14 | 17.19±4.21 | .0029 |  |
| Figural Fluency | 100.25±13.44 | 80.33±9.76 | .0004 | |
| Blocks Backward | 9.00±1.28 | 7.33±1.67 | .0118 | |
| Stockings of Cambridge | 10.25±1.42 | 8.17±2.21 | .0118 | |
| Intra-Extra Dimensional Shift Task* | 5.08±5.9 | 22.62±16.58 | .0023 |
t-tests
Mann-Whitney U test corrected for ties
n=11 for elderly
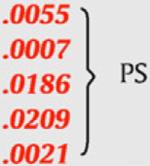
higher scores = worse performance, WM = Working Memory, MOT = Motor, PS = Problem Solving.
