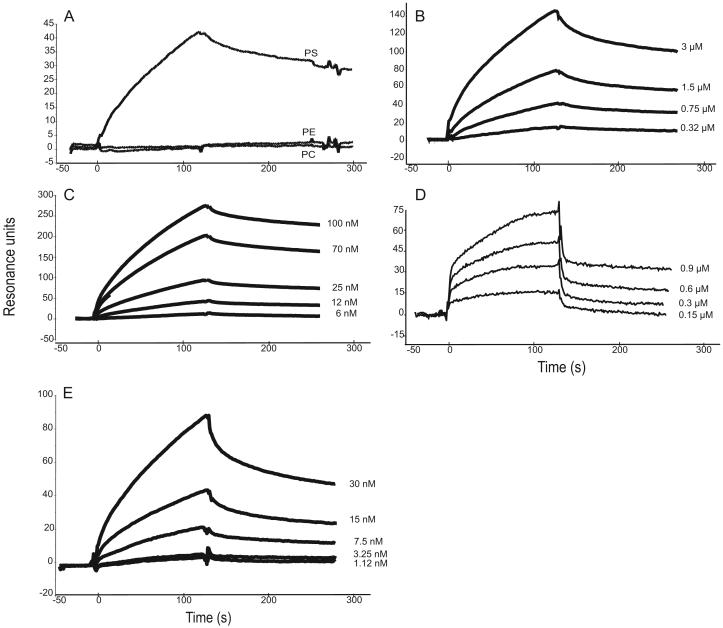
FIGURE 5.
SPR analysis of the interaction between C1q or its GR and PS or PS derivatives. A and B, Binding of the C1q GR to immobilized PS. C, Binding of intact C1q to immobilized PS. D, Binding of 06:0 PS to immobilized C1q. E, Binding of C1q to immobilized phosphoserine. All interactions were measured in the running buffer at a flow rate of 10 μl/min. Association and dissociation curves were each recorded for 120 s. The concentrations of soluble ligands were as follows: GR: 0.75 μM (A) and 0.32, 0.75, 1.5, and 3 μM (B); C1q: 6, 12, 25, 70, and 100 nM (C) and 1.12, 3.25, 7.5, 15, and 30 nM (E); 06:0 PS: 0.15, 0.3, 0.6, and 0.9 μM (D). All other conditions are described in Materials and Methods.

