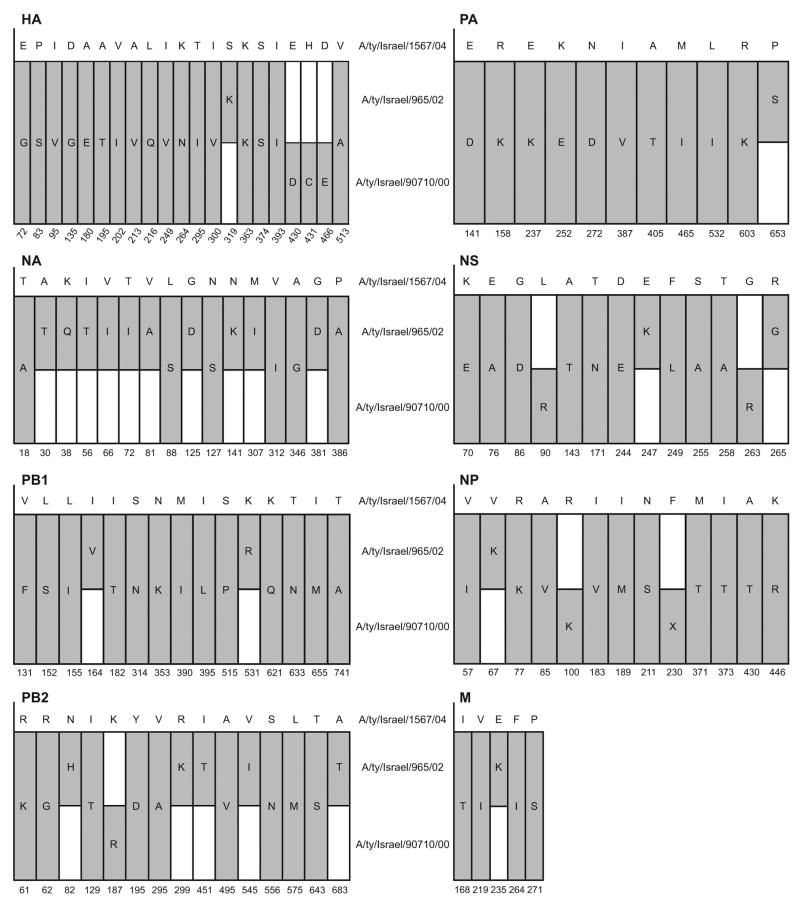
FIG. 1.
Representation of amino-acid differences between the three H9N2 viruses. Upper sequence in each graph is the sequence of the reference virus, A/ty/Israel/1567/04. Capital letters indicate amino acids. Dark bars indicate changes in the two other H9N2 viruses as compared to the reference sequence; white bars indicate no change. Positions not shown are identical in the three viruses. H9 numbering was used for the HA gene.

