Figure 2.
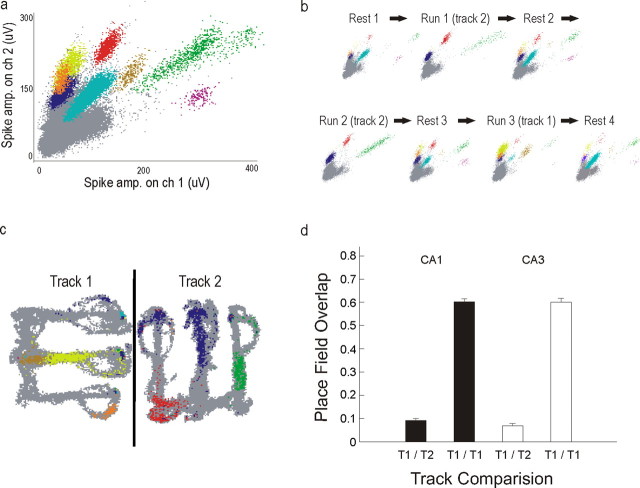
Recording stability and distinct spatial representations for the two tracks. a, Spike amplitudes on two of four tetrode channels recorded across 1 d (experimental day 12, animal 6, group 2). Different colors represent different clustered cells; gray points represent spikes that were not clustered. b, Spike amplitudes for each rest and run session illustrating the stability of recordings and the presence of some putative single neurons that were well isolated due to their activity during rest sessions but were silent or minimally active on the tracks (e.g., purple cluster). c, Spiking as a function of position for one run session on each track where each pixel in which a spike was detected is colored as in a. The black line represents the barrier between the tracks. The differences in the spiking patterns between track 1 and track 2 illustrate the distinct spatial codes for these two environments. d, Overlap between the linearized firing rates of the two runs from the same day across track 1 and track 2 (T1/T2) and two runs from the same day in track 1 (T1/T1). The low overlap of T1 and T2 indicates that the spatial firing patterns of individual CA1 and CA3 neurons differed across these two environments, whereas the high overlap of T1 with itself indicates that the spatial representation of the first track was generally stable within a day.

