
Figure 3.
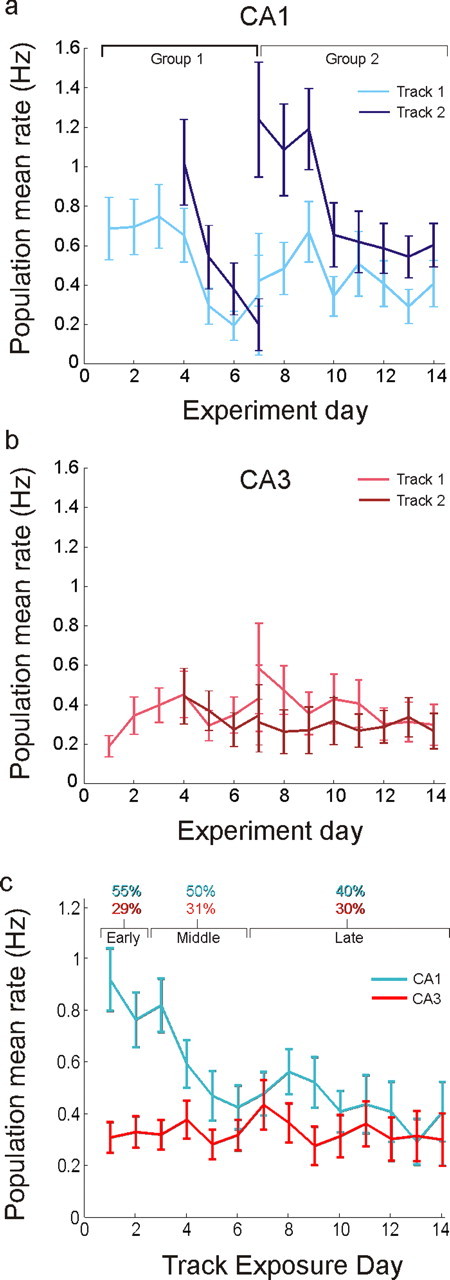
Hippocampal rate dynamics. a, Population average rates in CA1 as a function of experiment day. The set of days associated with each group is indicated at the top. Rates were high in each novel environment and then decayed over the course of a few days. Track 1, Group 2 illustrates the final firing rate level reached when animals had 6 d of experience on the track before recording began. b, Population average rates in CA3 as a function of experiment day. There were no significant changes in CA3 rates across days. c, Rates pooled from all animals and both tracks, plotted as a function of the number of days spent on the track. Top, Percentage of CA1 and CA3 cells active for the three novelty blocks, where “active” is defined as having a mean rate >0.1 Hz. Error bars represent SEM, calculated by repeated resampling of the data with replacement (bootstrap).