
Figure 2.
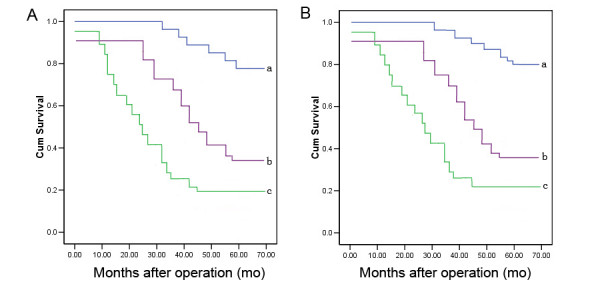
Kaplan-Meier survival curves for Nestin (A) and CD133 (B) expression in gliomas tissues. 'a', categorized by negative Nestin or CD133 expression; 'b', categorized by weak~moderate positive Nestin or CD133 expression; 'c', categorized by strong positive Nestin or CD133 expression. Survival was significantly poor for patients with strong positive Nestin or CD133 expression than those with negative expression (both p < 0.01).