
Figure 8.
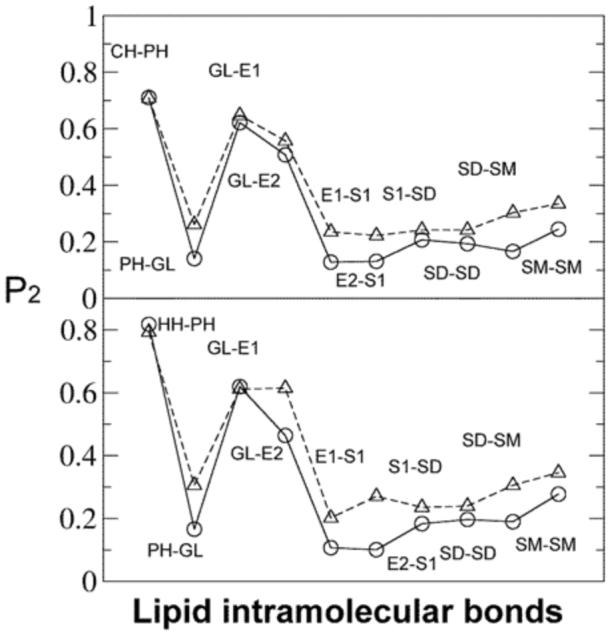
P2 order parameters of bonds with respect to bilayer normal from the CG simulation (solid line, circle) and the atomistic simulation (dashed line, triangle). Upper plot: DOPC lipids; lower plot: DOPE lipids. The lines are meant to guide the eye. See Figure 1 for CG site definitions.