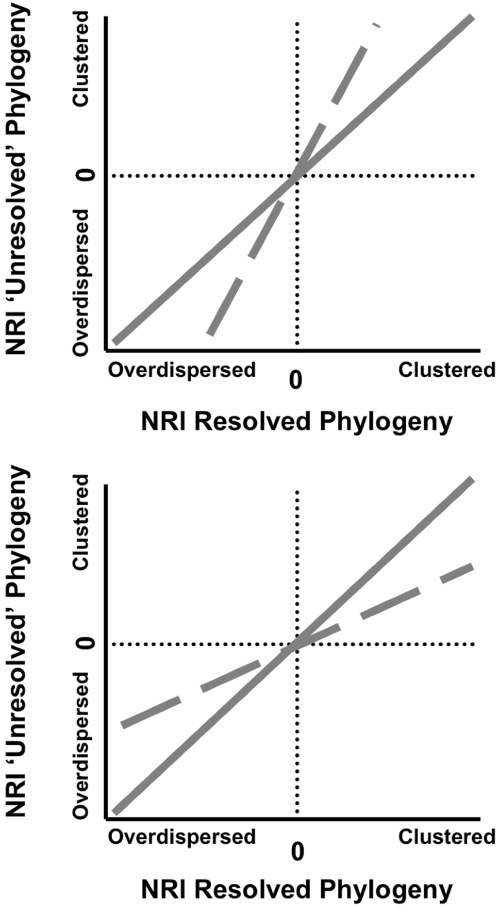
Figure 2. A graphical example how potential directional biases in phylogenetic dispersion produced by using phylogenetic trees containing polytomies were quantified in this study.
The value for a phylogenetic dispersion metric, in this example NRI, generated for a community using a phylogeny containing polytomies is regressed through the origin onto the NRI value generated from the same community using a fully resolved phylogeny (dashed lines). As in the above example, the expected relationship is a 1∶1 line through the origin (Solid Line). When the slope is greater than one (dashed line in the top panel) shows a bias towards higher phylogenetic overdispersion and phylogenetic clustering. In other words, a bias towards non-random phylogenetic structuring (False Positives; Type I Error). When the slope is less than one (dashed line in the bottom panel) this shows a bias towards lower phylogenetic overdispersion and phylogenetic clustering. In other words, a bias towards random phylogenetic structuring (False Negatives; Type II Error).

