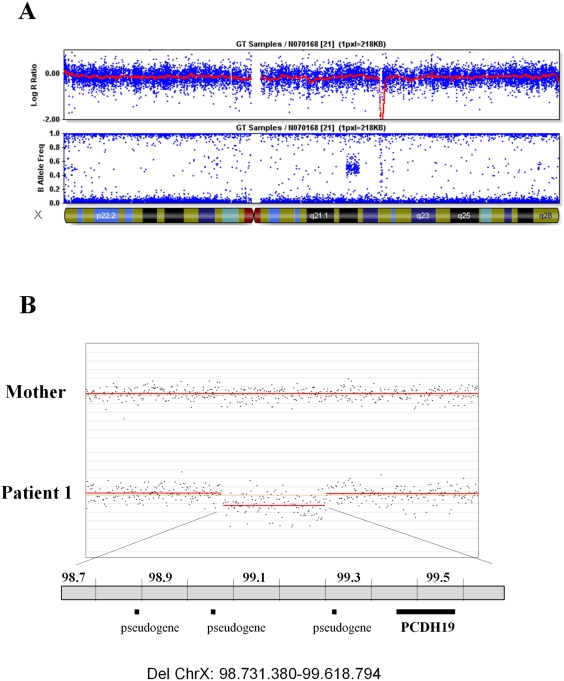
Figure 1. Identification of a deletion encompassing PCDH19 in a male patient.
A) Identification of a hemizygous Xq22.1 deletion with a 370 K SNP microarray (Illumina): Y-axes represent Log R ratio (above) and B allele frequency (below); the X-axis indicates the position on the X chromosome. The red line (log R ratio profile) corresponds to the median smoothing series (Beadstudio). B) Analysis of the patient and his mother with CGH microarrays (Nimblegen), showing that the deletion occurred de novo. Indicated genomic positions are based upon the Ensembl Genome Browser. Black horizontal bars (below) represent the gene (PCDH19) and pseudogenes comprised in the deleted region.

