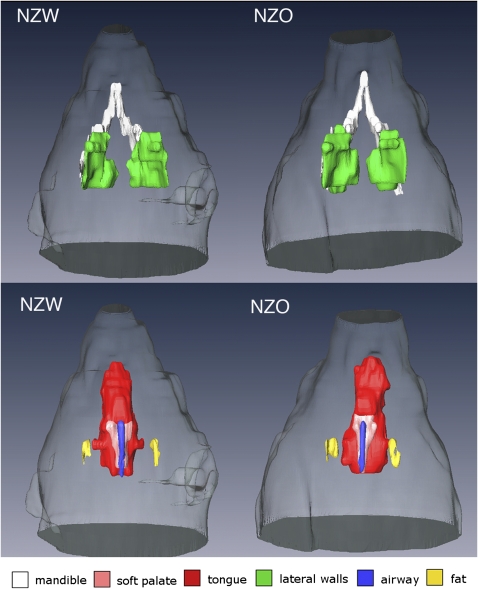
Figure 4.
Comparisons of volumetric projection images (dorsal, i.e., brain side) of the upper airway structures in representative New Zealand White (NZW) (left) and New Zealand Obese (NZO) (right) mice. Top row shows the mandible bone (white) the width of which is similar in size between the NZW (9.55 mm) and NZO (9.65 mm) mice, but the lateral walls (green) are larger in the NZO (120.3 mm3) compared with the NZW (91.5 mm3) mice. Bottom row is also a dorsal projected view that highlights the tongue: (red) (NZW = 126.7 mm3; NZO = 170.0 mm3), soft palate (pink) (NZW = 4.7 mm3; NZO = 6.2 mm3) and parapharyngeal fat pads (yellow) (NZW = 1.8 mm3; NZO = 4.4 mm3) all of which were larger in volume in NZO mice than in the NZW mice (Tables 2–3) and in these representative mice. Airway volume (blue) was slightly smaller in the NZO (1.90 mm3) compared with the NZW (2.11 mm3).

