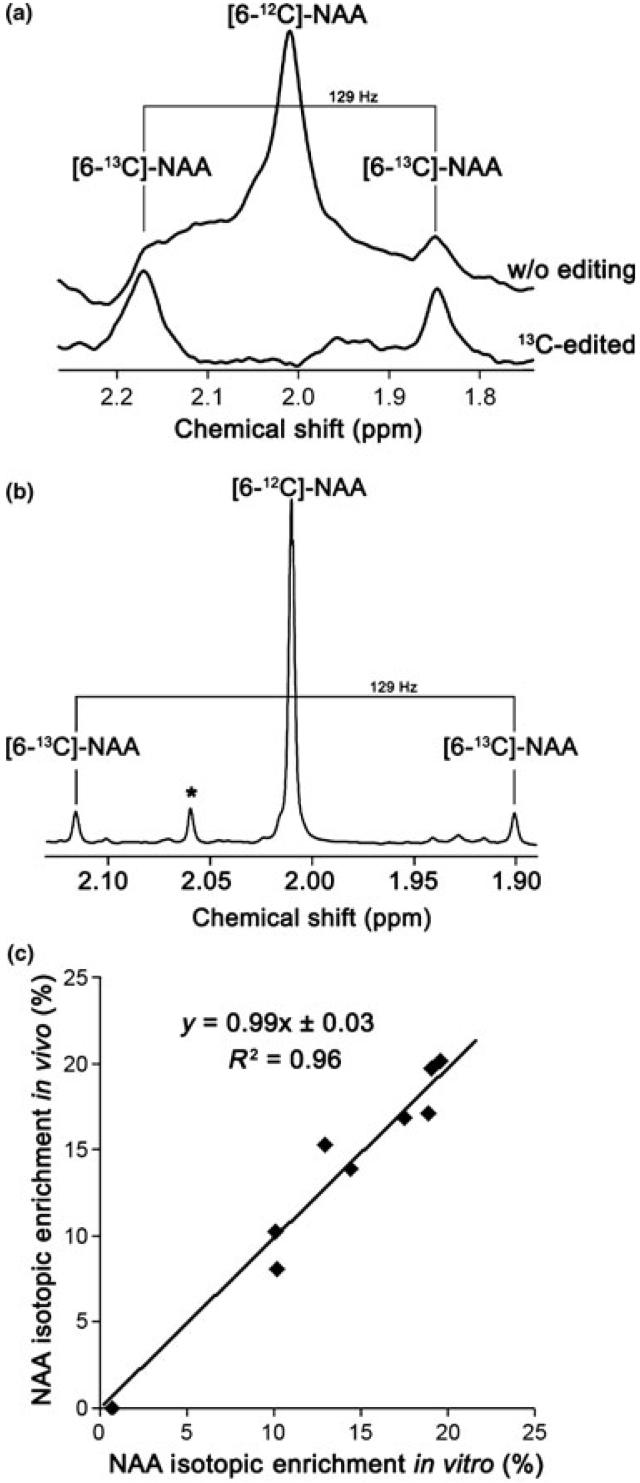
Fig. 2.
Comparison of in vivo measurement of NAA Isotopic Enrichment (IE) with in vitro measurement. (a) Example of in vivo NAA spectra with and without editing. It can be observed that the 2.17 ppm 13C peak satellite is slightly larger because of glutamate contamination. (b) Example of in vitro spectrum. Signals are much better separated. *NAA-G. (c) In vivo measurement of [6-13C]-NAA IE is identical to in vitro measurement (n = 9 rats, paired t-test, p = 0.62). The result of linear regression is shown.

