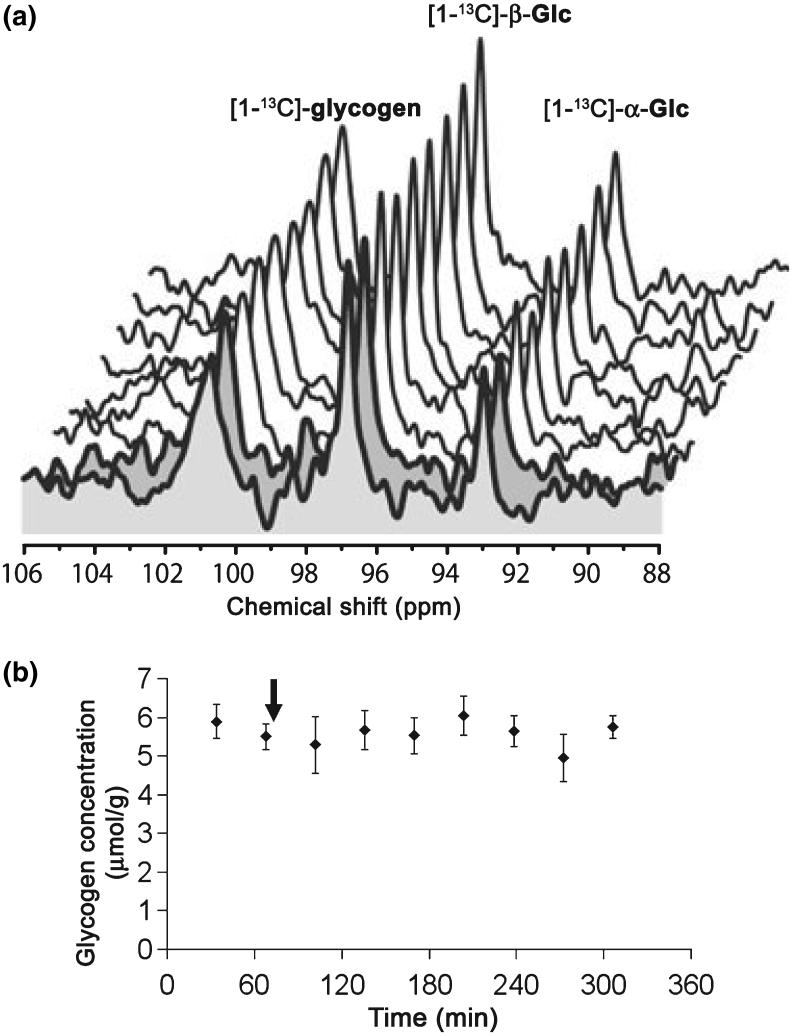
Fig. 7.
Apparent stability of the time-resolved NMR signal of glycogen during insulin infusion. (a) Time resolved stack plot (one spectrum each 34 min) of in vivo 13C spectra acquired in one rat showing localized detection of [1-13C]-glycogen and [1-13C]-Glc (α and β anomers). Whereas [1-13C]-Glc infusion was performed during the whole experiment (to maintain plasma glycemic levels around 10 mM) at an IE matching that estimated for glycogen, insulin infusion was started after the acquisition of the first two spectra (shown in grey). (b) Mean brain glycogen concentration (n = 5 rats) over time. n = 5 out of the six rats of this group; absolute quantification of glycogen was not possible in one rat because of instrument failure. The arrow indicates when insulin infusion started. Error bars indicate SEM.

