
FIGURE 4.
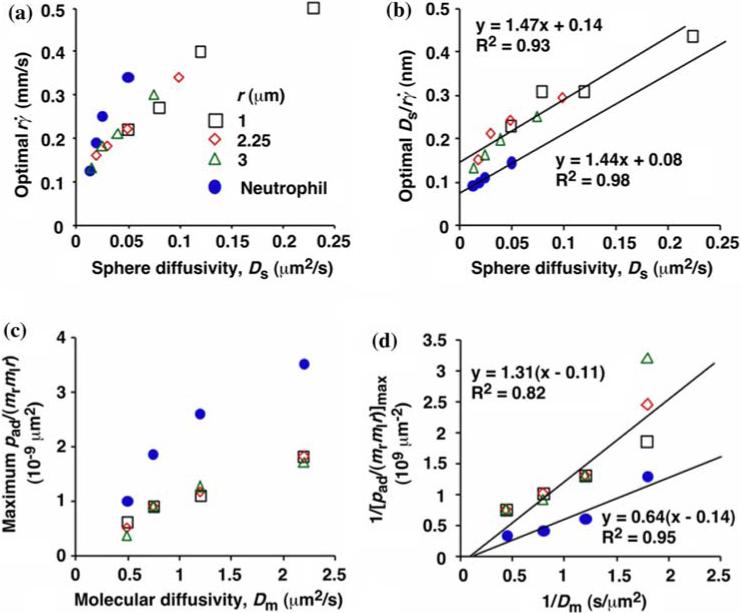
Analysis of optimal values of tether rate curves. (a) Peak locations of the pad/(mrmlr) vs. curves (optimal ) were plotted against the sphere diffusivity Ds. (b) Peak locations of the pad/(mrmlr) vs. curves (optimal ) where plotted against the sphere diffusivity Ds. (c) Maximum pad/(mrmlr) values were plotted against the molecular diffusivity Dm. (d) Reciprocal of maximum pad/(mrmlr) values were plotted against reciprocal of the molecular diffusivity. Positive correlations were evident in all plots for both microspheres (open symbols) and neutrophils (solid circles). A straight line was fit to each set of the data for microspheres or neutrophils in (b) and (d). The best-fit equations are indicated along with the R2 values. Reproduced from Yago et al.21