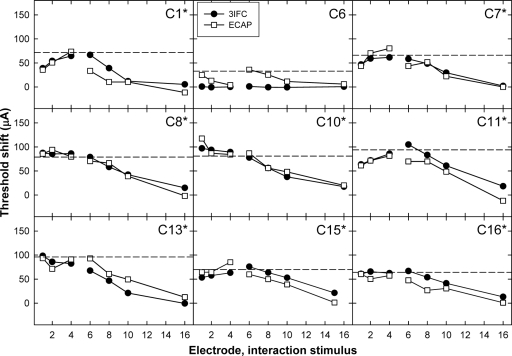
Figure 4.
Psychophysical (3IFC; filled circles) and ECAP (open squares) threshold shifts plotted as a function of interaction-electrode location for apical P5. Each graph represents data from a different subject. The horizontal dashed line represents the level of the interaction stimulus. The asterisks next to the subject numbers indicate a statistically significant correlation between ECAP and psychophysical threshold shifts (see Table 3).

