
Figure 3.
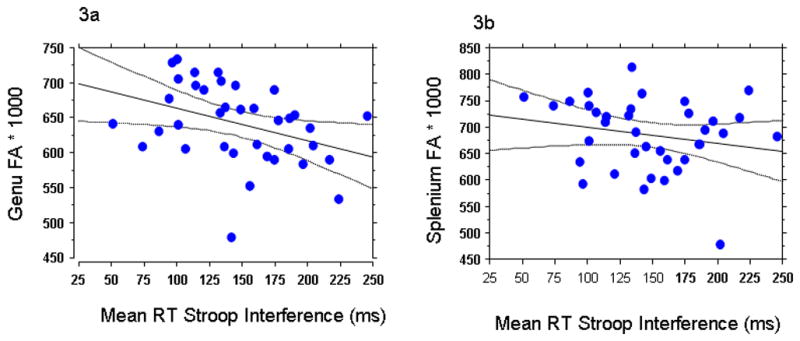
Correlational scatterplots between millisecond (ms) reaction time (RT) Stroop interference and Fractional Anisotropy (FA) *1000 values in the (3a) genu (r= .37, p=.04, corrected, bonferroni method)) and (3b) splenium (r=.23, p=.17) of 37 methamphetamine (MA) abusers.