FIG. 2.
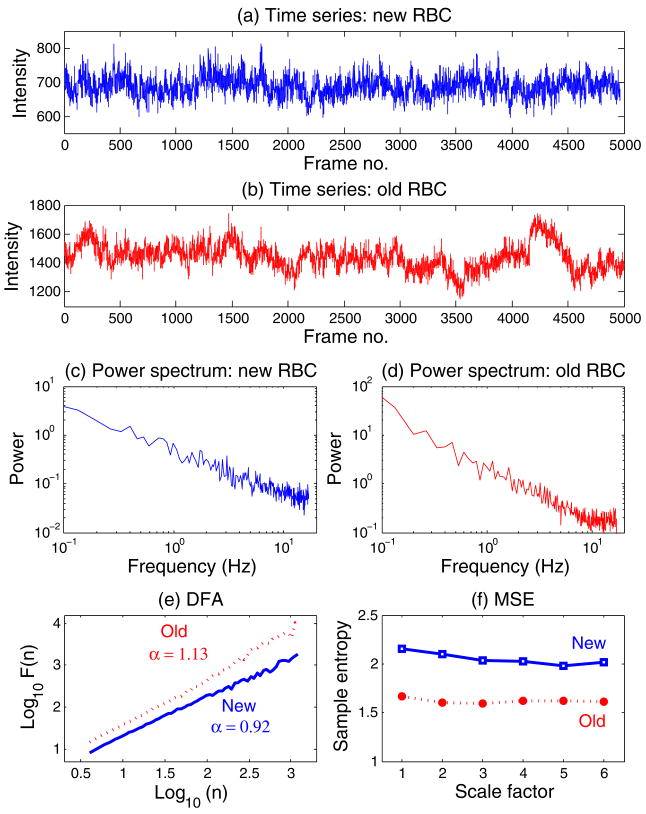
(Color online) Time series of a pixel from the new RBC (a) and the old RBC (b) shown in Fig. 1. The magnitude of the fluctuations is given in arbitrary units. (c), (d) Fourier power spectra for time series in (a) and (b), respectively. A smoothing procedure was applied, which consisted of averaging the spectra for consecutive overlapping segments of 512 data points. Note the absence of a dominant (characteristic) frequency. (e) Detrended fluctuation analyses (DFA) for the two time series shown in (a) and (b). Note that the α (fractal) exponent for the old RBC is higher (closer to 1.5) than for the new cell, indicating that the underlying dynamics of the former membrane is closer to Brownian motion than that of the latter, which shows scaling close to 1/f noise. (f) Multiscale entropy (MSE) analyses for the two time series shown in (a) and (b). The entropy measure (sample entropy [17]) is higher for the new than for the old RBC over time scales ranging from 0.029 (scale factor 1) to 0.174 s (scale factor 6). (Since the sampling frequency is 34 Hz, the scale factor increments by steps of 1/34=0.029 s.)

