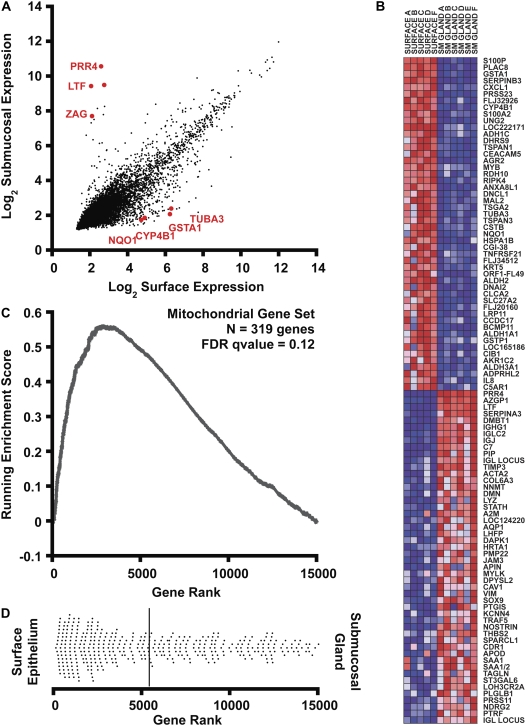
Figure 2.
Bioinformatic analysis of gene expression. (A) Correlation of gene expression levels in surface epithelia (x axis) with submucosal glands (y axis). Expression signals were log2 transformed and normalized by the RMA procedure. Some genes selected for further analysis are displayed in red. (B) Gene set enrichment analysis (GSEA) heatmap output for the 100 most differentially expressed transcripts in human bronchus surface epithelium and submucosal glands. The columns represent unique array hybridizations using either surface epithelial RNA (SURFACE) or submucosal gland RNA (SM GLAND). The donor number is also indicated after the tissue type. Red indicates high expression and blue low expression. Probe IDs are listed on the right of the figure. (C) Metabolic pathway upregulation (mitochondrial genes) in surface epithelium assessed by gene set enrichment analysis. A total of 14,989 genes were rank ordered by relative expression in surface epithelium, and an enrichment score (ES) was calculated using these rank order data weighted by a correlation coefficient using GSEA software (7). The upward deviation of the ES curve demonstrates the positive enrichment of the gene set in surface epithelial cells. (D) The dot plot represents the ranks of individual genes belonging to the mitochondrial gene set (n = 319) within the cumulative list of genes. The distribution is skewed to the left, indicating enrichment of mitochondrial transcripts in surface epithelial cells. The solid bar represents the mean rank of this gene set.

