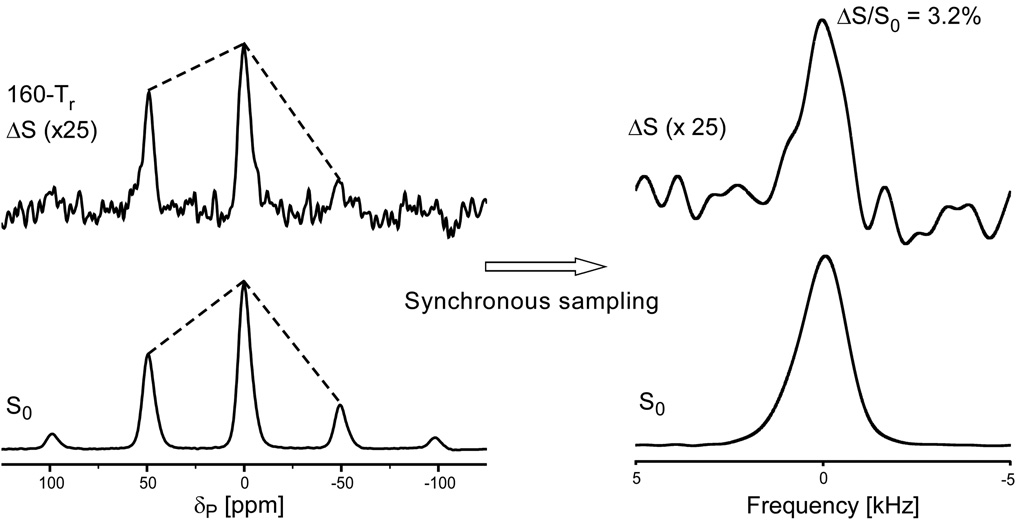
Figure 10.
31P{15N} REDOR spectra of [ε-15N]lysine-labeled phage T4 after 160 Tr of dipolar evolution. The full-echo spectrum (S0) is at the bottom of the figure and the REDOR difference spectrum (ΔS) is at the top. The dissimilarity of REDOR difference and full-echo spectra (dotted lines) indicates an orientational preference for the 15N-31P internuclear vector relative to the 31P chemical shift tensor. The NMR signal was digitized at 40 times the spinning speed (10 kHz) so that the Fourier transform of every 40th time-domain data point resulted in the rotor-synchronized spectra on the right. The spectra were the result of the accumulation of 373,792 scans.

