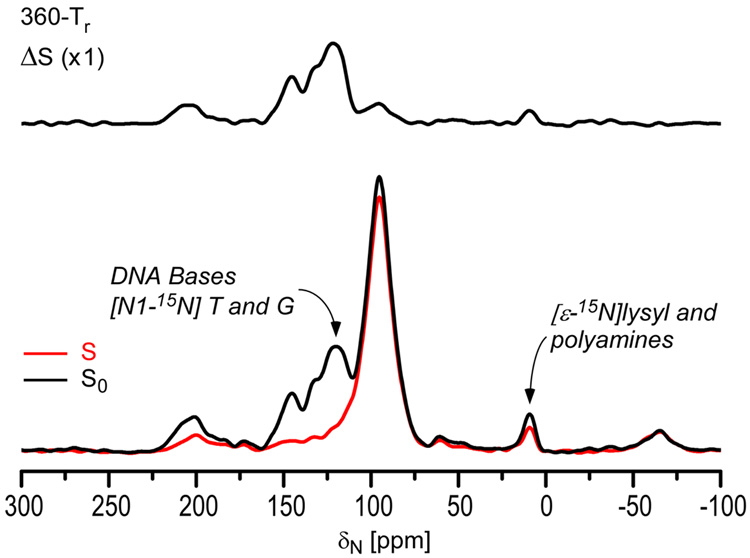
Figure 3.
15N{31P} REDOR spectra of uniform 15N labeled phage T4 after dipolar evolution for 360 Tr (45 ms). The REDOR difference is shown at the top and the normal full-echo spectrum (black) and diminished echo spectrum (red) at the bottom. The spectra were the result of the accumulation of 13,752 scans.

