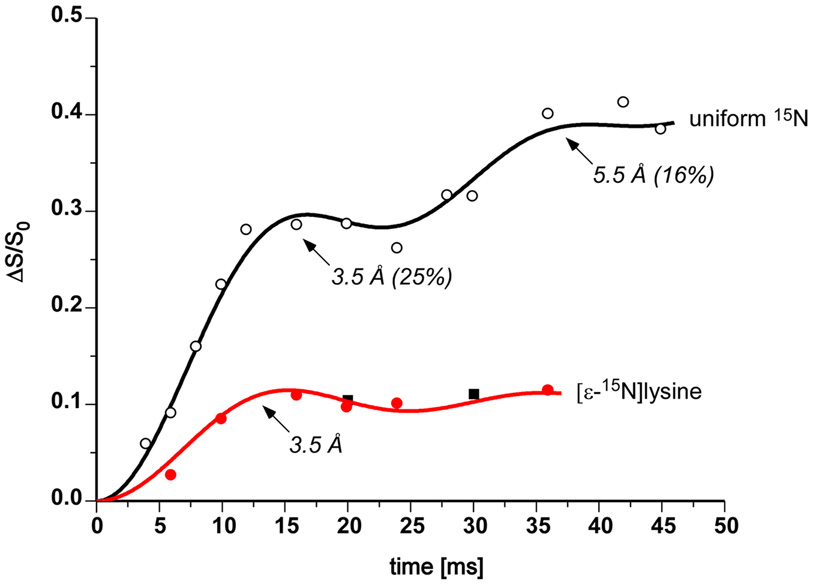
Figure 8.
15N{31P} REDOR dephasing (ΔS/S0) for the 9-ppm amine peak as a function of dipolar evolution time for uniform 15N and [ε-15N]lysine-labeled bacteriophage T4. The observed dephasing (solid circles and squares) of [ε-15N]lysine-labeled phage T4 (100 mg lysine/L media, red; and 200 mg lysine/L, black) is consistent with that calculated (red line) assuming a single 15N-31P distance of 3.5 Å. The observed dephasing (open circles) of uniform 15N-labeled phage T4 is consistent with that calculated assuming an 15N-31P distance of 3.5 (± 0.2) Å for 25 (± 3) % of the amines, and 5.5 Å for 16%.

