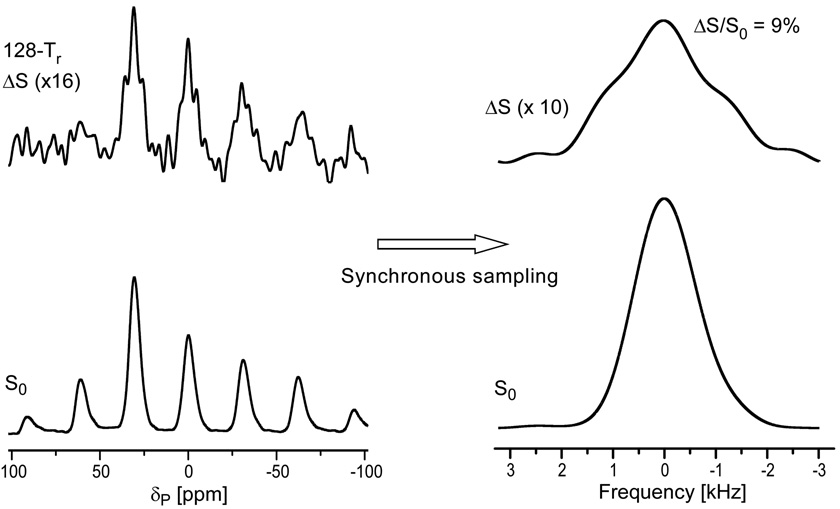
Figure 9.
31P{15N} dbFSR spectra of uniform 15N-labeled phage T4 after 128 Tr of dipolar evolution. The full-echo spectrum (S0) is at the bottom of the figure and the REDOR difference spectrum (ΔS) is at the top. The DANTE carrier frequency was centered at the 9-ppm amine peak. The spectra on the left show sidebands resulting from magic-angle spinning at 6250 Hz. The NMR signal was digitized at 64 times the spinning speed so that the Fourier transform of every 64th time-domain data point resulted in the rotor-synchronized spectra on the right. The spectra were the result of the accumulation of 316,968 scans.

