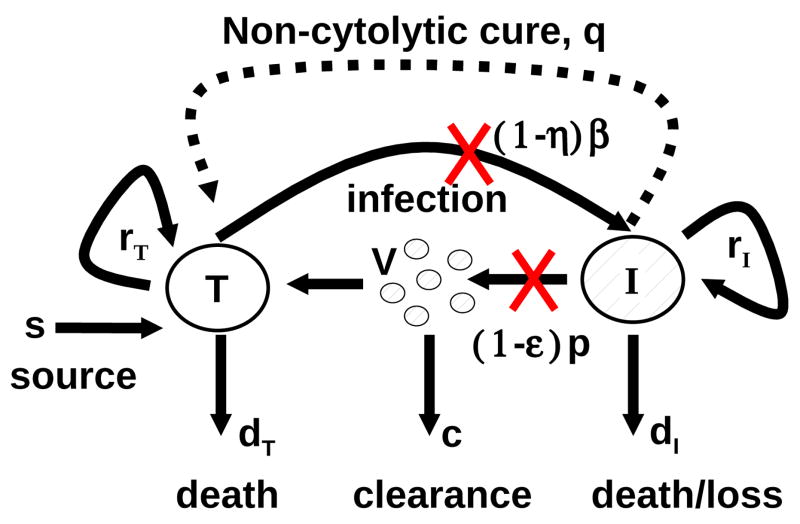
Fig. 1.1.
Schematic representation of HCV infection models. T and I represent target and infected cells, respectively, and V represents free virus. The parameters shown in the figure are defined in the text. The original model of Neumann et al. [37] assumed that there is no proliferation of target and infected cells (i.e., rT = rI = 0) and no spontaneous cure (i.e., q = 0). The extended model of Dahari et al. [6], which was used for predicting complex HCV kinetics under therapy, includes target and infected cell proliferation without cure (rT, rI > 0 and q = 0). A model including both proliferation and the spontaneous cure of infected cells(dashed line; q > 0) was used to explain the kinetics of HCV in primary infection in chimpanzees [5].

