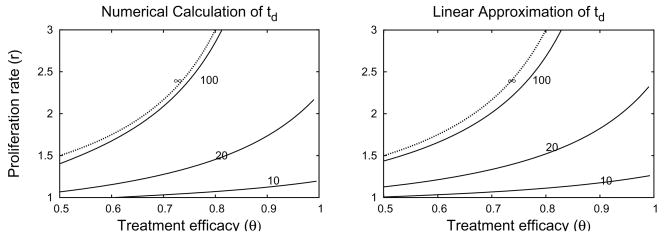
Fig. 4.5.
Side-by-side comparison of contour plots of the treatment td using numerical solution of system (2.7) (left) and the Formula (4.8) derived from the linear approximation (right). The approximate bound on bistability, , labeled ∞, is the same in both plots. Contour heights are 10, 20,100 and ∞. Parameter values d=0.5, b=1, s=10−3, q=0.θc=0.5 when r=0 in both plots.

