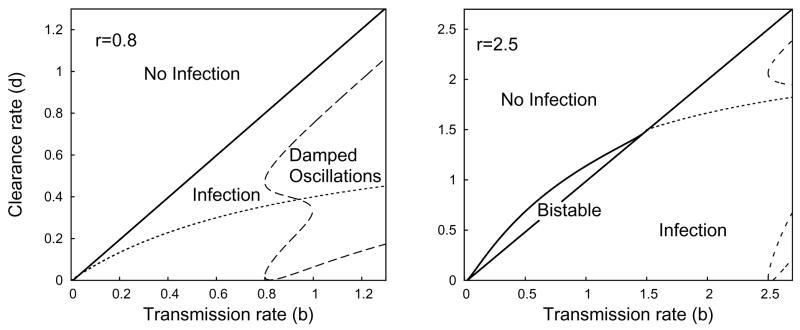
Fig. 3.6.
Plot representing the parameter regions for asymptotic dynamics of System (2.7) with s = 0.01, q = 0 when r = 0.8 (left) or r = 2.5 (right). Compare to Figure 3.1. The dashed line represents the boundary of the parameter region where convergence to the steady state exhibits damped oscillations. The dotted line represents the bifurcation boundary between partial and total infection when s = q = 0. However, there is no formal bifurcation between partial and total infection if s or q is positive because of the structural instability of the transcritical bifurcation in System (2.8).

