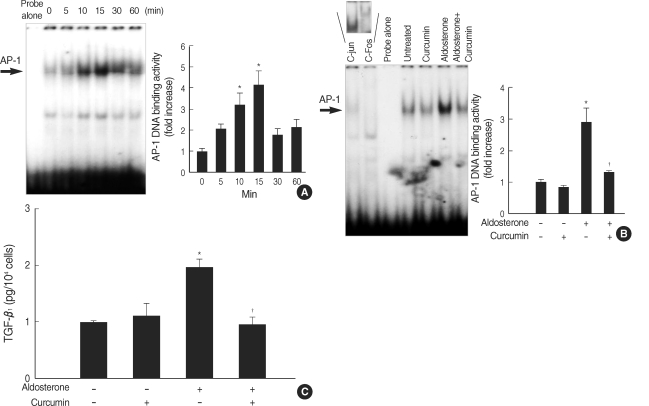
Fig. 3.
Role for AP-1 activation in the aldosterone-induced TGF-β1 expression. (A) Time course for AP-1 activation by aldosterone. Cells were incubated with aldosterone (5 ng/mL) for the indicated time points. AP-1 DNA binding activity in the nuclear extracts was measured by EMSA using AP-1 consensus oligonucleotides. *p<0.05 vs. untreated control. (B) Inhibition of aldosterone-induced AP-1 activity by curcumin. Cells were pre-incubated with or without AP-1 inhibitor, curcumin (12.5 µM), for 15 min, and then stimulated with aldosterone (5 ng/mL) for 15 min, and EMSA was performed. *p<0.05 vs. untreated control. †p<0.05 vs. aldosterone-treated cells. In some experiments, the nuclear extracts from aldosterone-stimulated mesangial cells were pre-incubated with or without an antibody to c-jun or c-fos for 1 hr at room temperature and were then analyzed for AP-1 binding activity. Pre-incubation of nuclear extracts with c-jun or c-fos antibody induced supershift of aldosterone-induced AP-1 activity (upper panel). In both (A) and (B) Left panel, the autoradiograph is a representative of five independent experiments with similar results. Right panel, the optical density of autoradiographic signals was quantified and calculated as the ratio of aldosterone-treated cells to untreated control. Results are expressed as fold increase over untreated control (represented as 1) in densitometric arbitrary units. Each value represents the mean±SEM. (C) Inhibition of aldosterone-induced TGF-β1 production by curcumin. Cells were pre-incubated with or without curcumin (12.5 µM) for 15 min, and then incubated with aldosterone (5 ng/mL) for 24 hr and TGF-β1 protein was measured by ELISA. *p<0.05 vs. untreated control. †p<0.05 vs. aldosterone-treated cells.

