
Fig. 1.
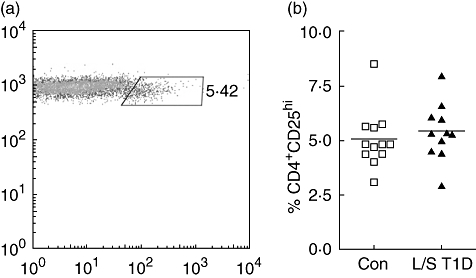
Isolated populations of CD4-positive cells were stained for expression of CD3, CD4 and CD25 and analysed by flow cytometry. CD25hi T cells were defined as those with a slightly lowered expression of CD4 (a). The percentage of CD4+ T cells in control subjects (squares) and patients with long-standing T1D (triangles) which were CD25hi. Each point represents an individual and mean values are indicated with a horizontal line (b).