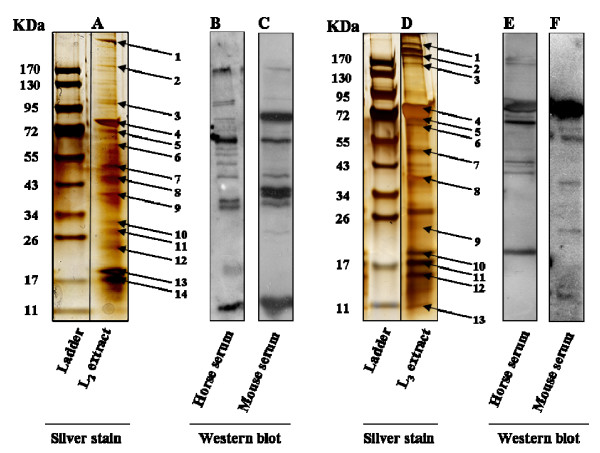
Figure 1.
1-D analysis of the LCE of L2 and L3. Representative 1-D silver-stained gel of LCE of L2 (A) and L3 (D). The arrows indicate the bands that were selected for mass spectrometry. Western blot analysis of L2 incubated with horse serum (B) and mouse serum (C). Western blot analysis of L3 incubated with horse serum (E) and mouse serum (F). The protein identification by MS is presented in Table 1 and 2.

