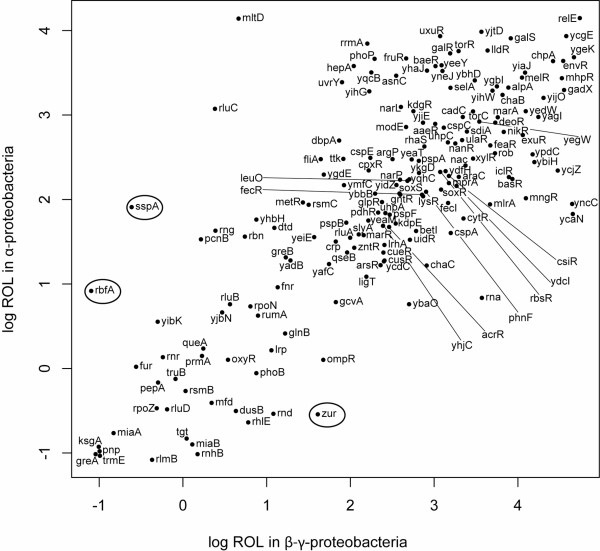
Figure 4.
Correlation between gene ROL values for information transfer RNA related ((MultiFun class 2.2) nonessential genes. The ROL values for γ-β-proteobacteria and α-proteobacteria are plotted. Each point indicates the estimated ROL value for that gene (orthologue set) in γ-β-proteobacteria as opposed to α-proteobacteria; the E. coli gene name is plotted next to the point. There is a highly significant relationship between individual ROL in the two clades (r2 = 0.584, p < 0.0001; Spearman's ρ = 0.71, p < 0.0001). Three genes that fall far from the expected values are circled; the phylogenetic pattern of conservation for these genes is shown in Figure 5.

