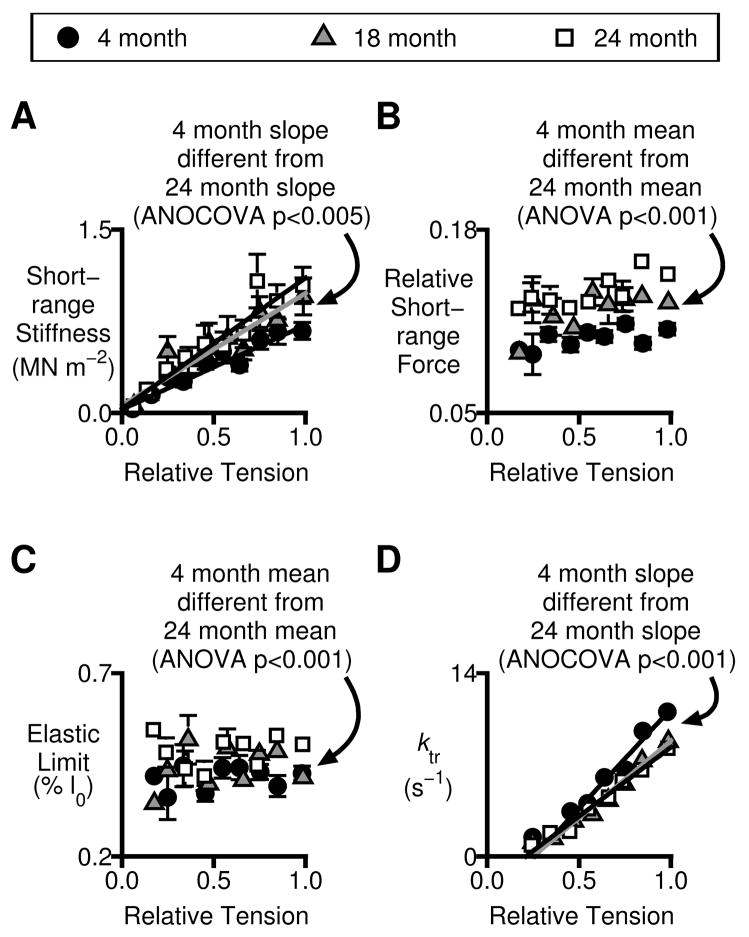
Figure 4.
Short-range mechanical properties and tension recovery kinetics. All plots show mechanical properties plotted as functions of relative isometric tension. Symbols show mean ± SEM values measured in a given pCa solution. Statistical analyses are described in the text. A) Short-range stiffness. B) Relative short-range force (short-range force normalized to Pss). C) Elastic limit. D) ktr.

